This section introduces the capability of the element Report in Business Designer on supOS.
- Log in to supOS, and then select
 > Business Designer.
 - Create a new application, and then add a new page inside.
- Drag a Report element onto the canvas, and then double-click the report.
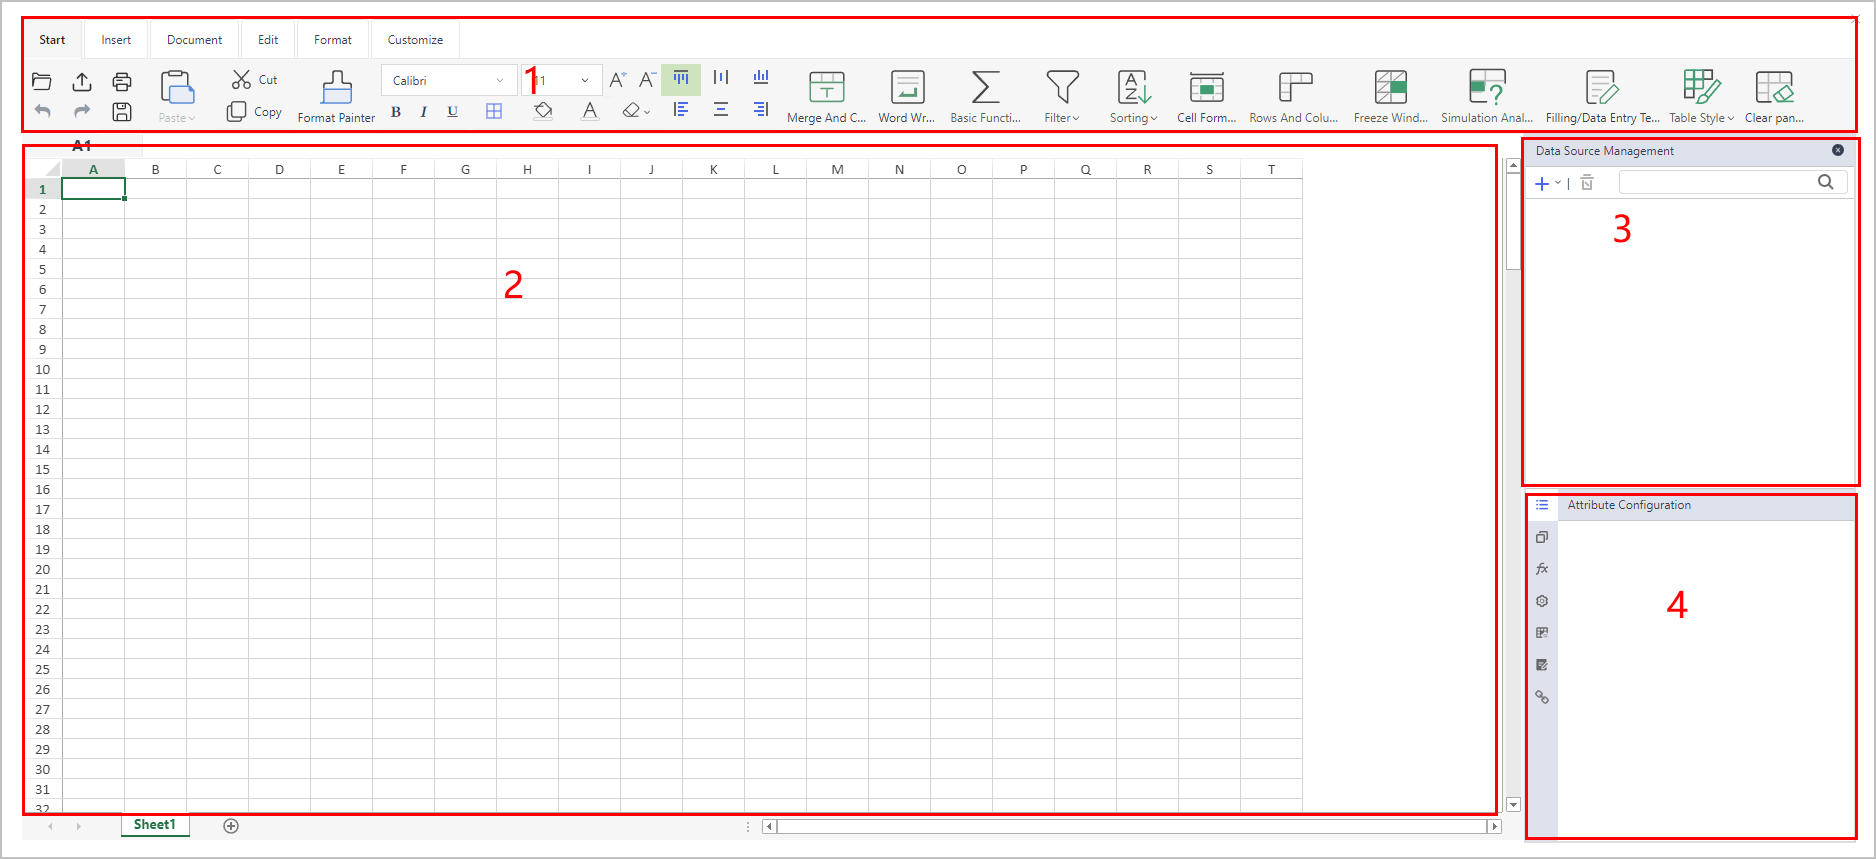
| No. | Part | Description |
|---|---|---|
| 1 | Toolbar | Contains all tools you use on the table. |
| 2 | Table | Displays the added data, and supports general functions similar to Excel. |
| 3 | Data Source Management | Add data source for the report table. |
| 4 | Report Configuration | Table functions configuration. |
Toolbar
Functions of the report are similar to excel and only special features are listed in this section.
Start
- Cell Format: Aside from general functions, Report provides other different features.
- Type: Select the cell type from a drop-down list and an edit box, and you can set the options of the drop-down list.

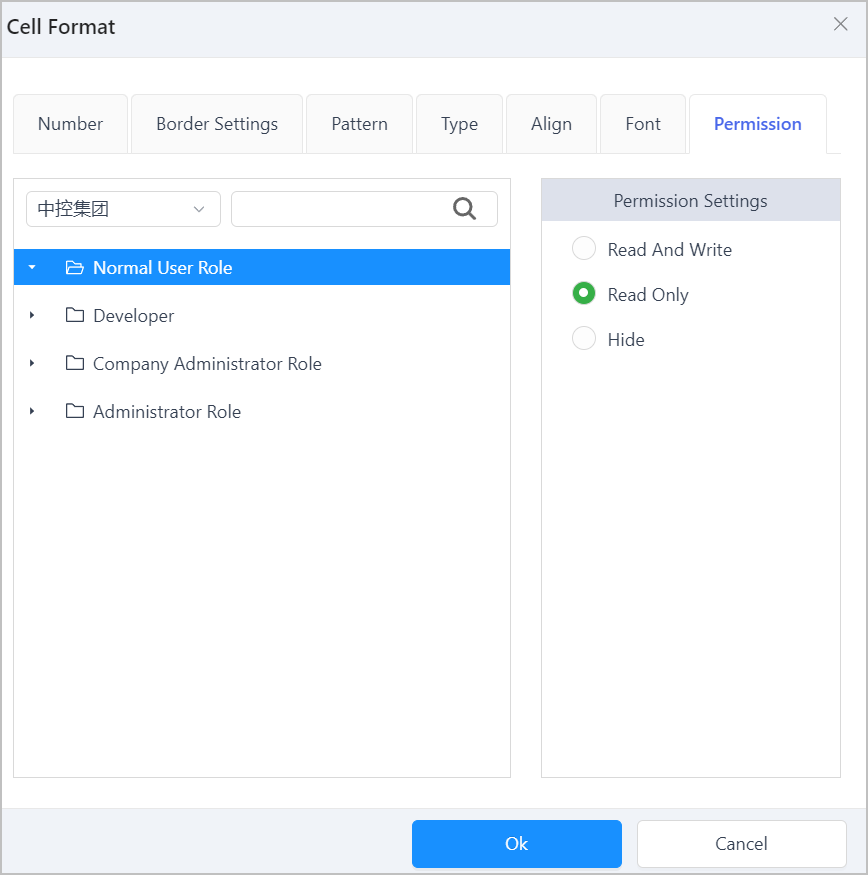
- Permission: Grant different permissions of the selected cells to different users in operation center.
Simulation Analysis
Filling/Data Entry Template: Edit data sources, including form template and data query.
Table Style: Select the style of the table, and you can customize new styles under Customize.
Clear Panes: Clear all parent cells settings.
Insert
You can insert charts, rows and columns, images and data sources to the table. For details on inserting data sources, see Data Source Management.
Customize
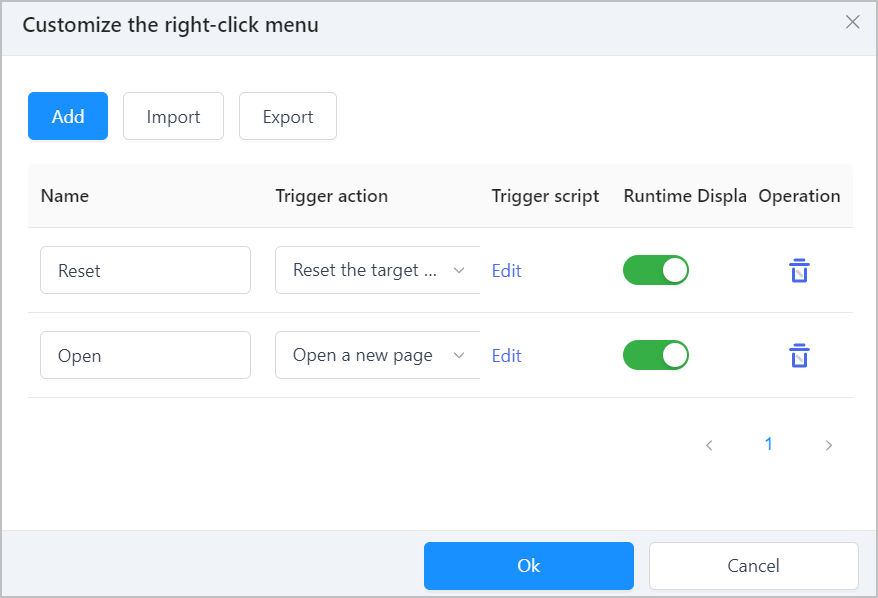
- Right-Click Menu: You can select actions and click Edit to write function script, import, and export the menu to JSON file and call it in other report elements.
Example codes:
// Reset the target cell
/** __ACTION__START__ **/
spread.suspendPaint();
// set cell value
let cellVal = '';
curCell.value(cellVal);
spread.resumePaint();
/** __ACTION__END__ **/
// Open a new page
/** __ACTION__START__ **/
const cellValue = curCell.value(); // cell value
const formul = curCell.formula(); // cell formula
const url = ''; // page url
window.scriptUtil.openPage(url);
/** __ACTION__END__ **/
// Open a modal window
/** __ACTION__START__ **/
const cellValue = curCell.value(); // cell value
const formul = curCell.formula(); // cell formula
const config = {
modalTitle: '', // title
url: '' // page url3
}; // modal window configuration
window.scriptUtil.renderModal(config);
/** __ACTION__END__ **/
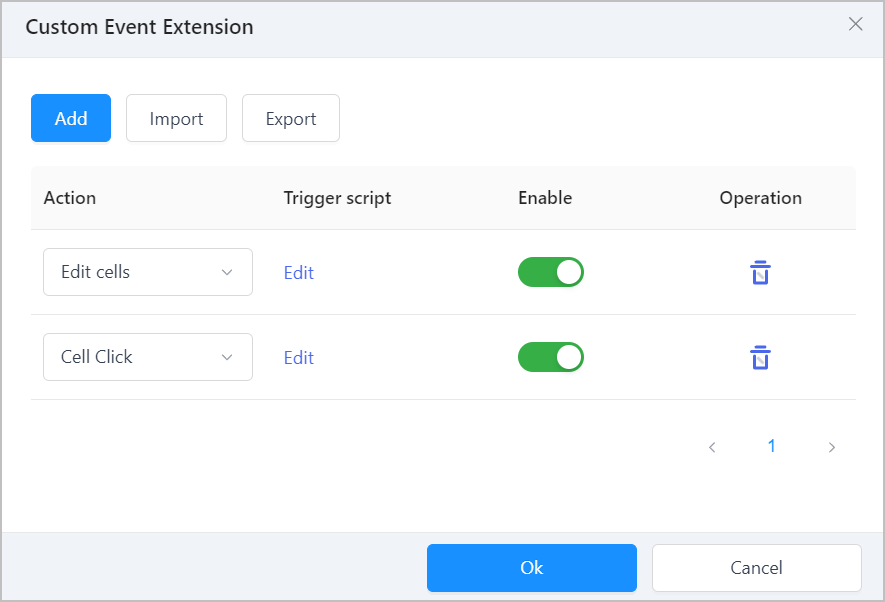
- Event Extensions: Customize events such as edit cell, click and finish editing. You can export the event to JSON file and call it in other report elements.
Example codes:
// Edit cells
// add 4 params, reporter/curCell (currently selected cell)/spread (SpreadJS instance) editingText
console.log("editingText: ", editingText);
console.log(curCell.formula());
setTimeout(function() { // simulate request
spread.suspendPaint();
const res = { status: 400 };
if (res === 400) { // request error
curCell.value(''); // empty the cell
} else {
reporter.reported(); // fill
} spread.resumePaint();
}, 500);
// Cell click
//add 3 params, reporter/curCell (currently selected cell)/spread (SpreadJS instance)
const value = curCell.value();
console.log("value: ", value);
const {row, col} = curCell;
spread.suspendPaint();
if (row === 2 && col === 2 && value === 'Print') { // C3 is print
const activeCell = spread.getActiveSheet().getCell(2, 1);
activeCell.formula('=SUM(A1, B2)'); // set formula for A3
reporter.print(); // print report
} spread.resumePaint();
Data Source Management
Add object instances, templates, services or data query commands, and then you can directly drag corresponding attributes, fields or parameters into the report.
A key field is generated after adding object data. It adds a column of index number for those data. Time series data will not generate key.
Adding Object Model
You can add object template, instance and service by selecting  > Object Model under Data Source Management.
- Only the first 200 attributes can be displayed of each instance. You can right-click the cell, select Insert Formula > Data Source to add more.
- Right-click a cell and select Insert Formula > Built-in Function, enter related information to add a date function to the cell.
- Add object instance
- Select > Object Instance under Data Source Management.
- Select an object instance under the Object instance-attribute tab in the pop-up window, and then click Save.
- Drag the added instance from the data source list to the report, and then select the cell, configure its properties under Attribute Configuration at the lower-right corner.

Parameter Description Display Type Select whether to display time or value of the history data in the cell. Time Granularity Time interval at which the history data is integrated and analyzed. Numeric Type Select calculation methods which are applied to the data collected according to the set Time Granularity. Sorting Sorting method of the selected cell. - When the cell has parent cells: Follows the top parent cell sorting. For example, A1 ascending, B1 none, C1 descending, A1 is the parent cell of B1 and B1 is the parent cell of C1, then B1 and C1 are all ascending sorting, same as A1.
- When the cell has no parent cells: Follows the set sorting.
Group Key Value Set a field to group the data source. Fill Type Select the data to fill in the report. - Autofill: Select data filling direction and maximum number (1-500) of data to be displayed.
- Fixed: Get the data of a fixed index from 1 to 500.
- Add template attribute or service
- Select > Object Instance under Data Source Management.
- Select an object property or service under the Object Template or Object Instance-Service tab in the pop-up window, and then click Save.
- Drag the added property or service from the list to the report, and then click the cell, configure its properties under Property Configuration at the lower-right corner.

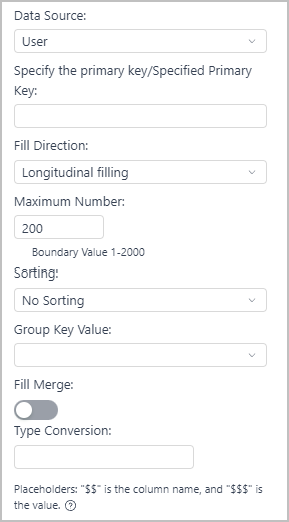
Parameter Description Data Source Select fields of the data source to fill in the cell. Fill Direction Select data filling direction. Maximum Number The maximum number of data that can be displayed. It ranges from 0-200. Sorting Sorting method of the selected cell. - When the cell has parent cells: Follows the top parent cell sorting. For example, A1 ascending, B1 none, C1 descending, A1 is the parent cell of B1 and B1 is the parent cell of C1, then B1 and C1 are all ascending sorting, same as A1.
- When the cell has no parent cells: Follows the set sorting.
Group Key Value Set a field to group the data source. Fill Merge Enable it and then when filling a cell, adjacent cells on the filling direction will be merged together.
Adding Data Query
Search results of third party data sources such as mysql, oracle, sqlserver and AHNA.
- Select > Data Query under Data Source Management.
- Select a data source from databases that have been registered under Storage Resources > Resources Management.
- Enter SQL commands and click
 to preview search results.
${param} can be used as a unspecific parameter when entering SQL commands. Make sure the ${param} is displayed the same as the real parameter. For example, the original parameter is 'zhangsan' (string), and the command can be select * from tablename where user='${param}'.
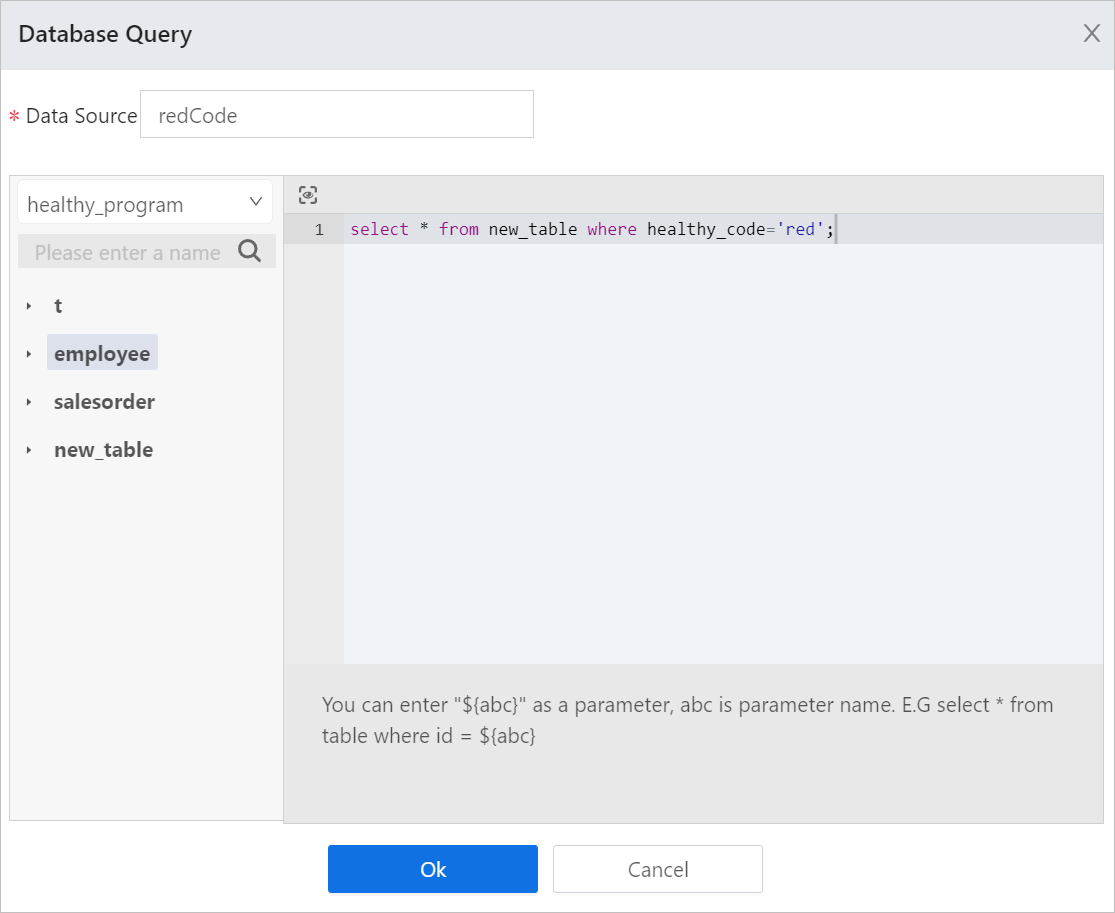
- Enter Data Source Name as the data set for search results.
- Click OK, and then the result data set is displayed under Data Source Management.
- Drag a field to the report, and then click the cell to configure its properties.
| Parameter | Description |
|---|---|
| Specify Primary Key | Set a filed in the table to be the primary key. You can also select and combine multiple fields to be a primary key to ensure its uniqueness. |
| Type Conversion | Convert time data in Oracle. Placeholder $$ is used as column name, and $$$ is value. tip Input format example
|
Report Configuration
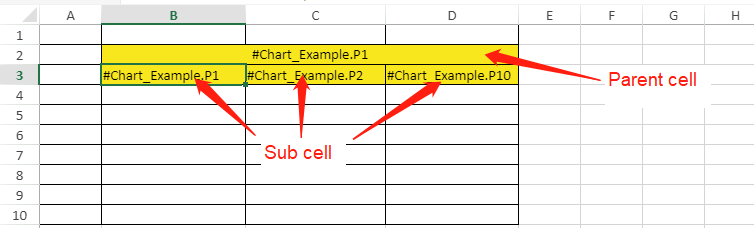
Parent Cell
Bind the selected cell with custom parent cell.
- Set one parent cell: Set only one parent cell, the sub cells copy filling direction and number of displayed data from the parent cell, and the relative position stays the same.
- Set both parent cells: Data filled in sub cells is filtered according to its parent cells.
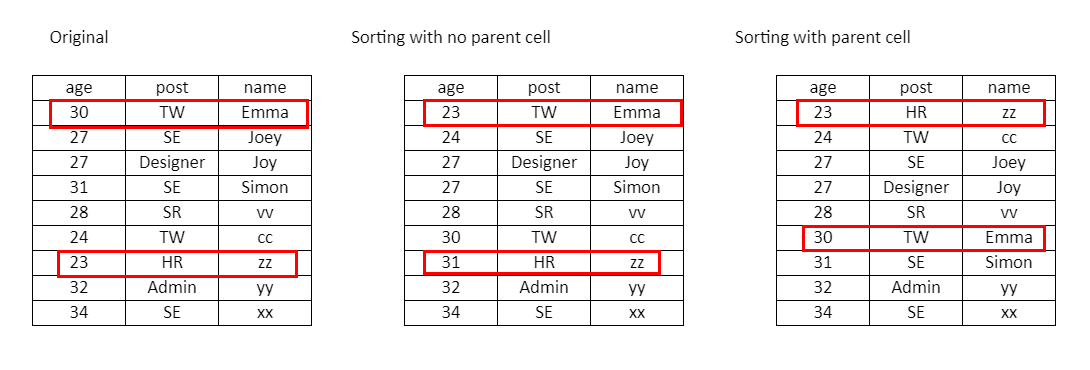
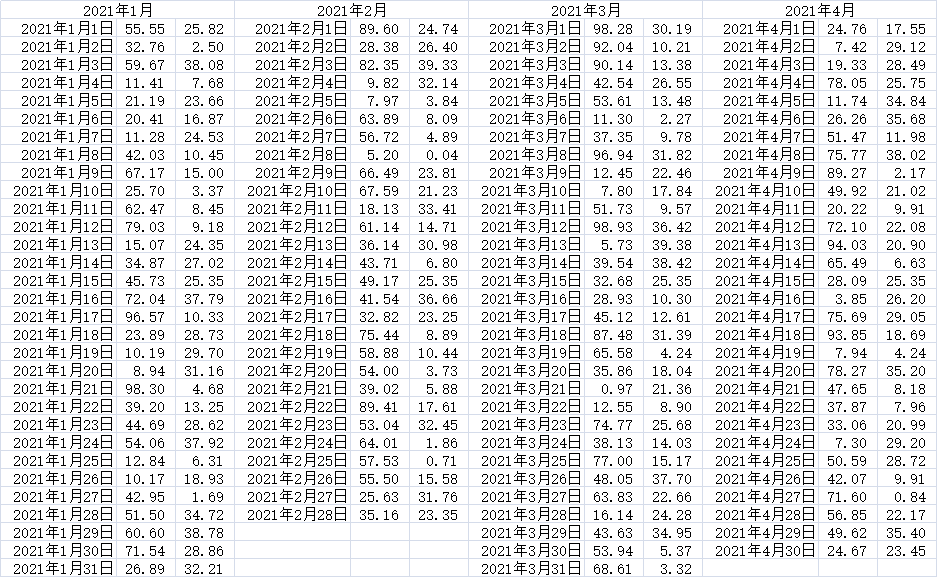
Relational Data
Relational data, after sorting, can only be correctly displayed with parent cell settings.
- Set the Fill Type of the report to Insert.
- Darg data source to the report.
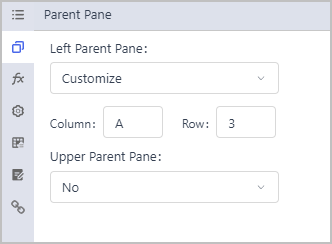
- Select a cell to be the sub cell, and then select Customize under Left Parent Pane.
- Set the left cell to be the parent cell, and enter the cell row and column number.info
In this example, the first cell is the parent cell of the second one, and the second cell is the parent cell of the last cell.
- Set the parent cell sorting, and check the preview effect.
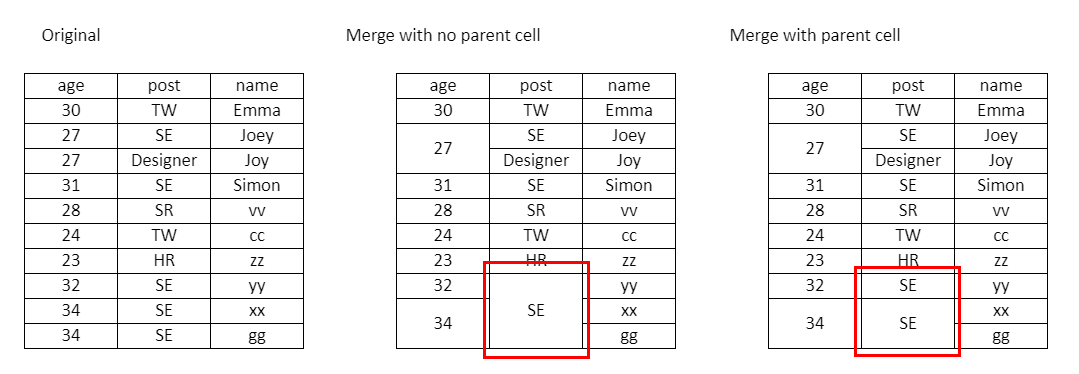
Cell Merge
Sub cells will merge according to the parent cell after parent cell settings.
- Select data source and set parent cells.
- Set the parent cell and sub cell merge, and check the preview effect.
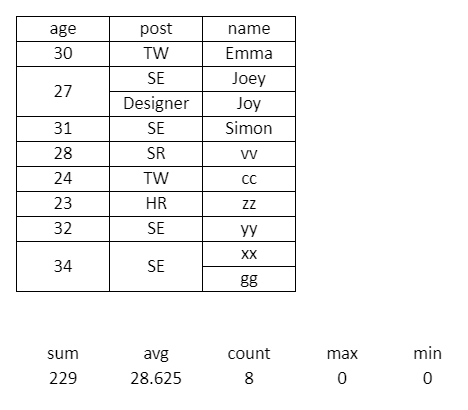
Aggregation Formula
Calculate cells set with provided formulas.
- Drag data into a cell, and then select another cell and click Basic Function on the top tool bar.
- Select a function, and select the first cell to be the calculation target.
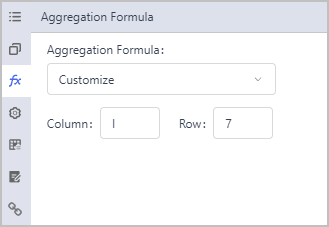
- Click Aggregation Formula at the lower-right corner.
- Select Customize, and then enter the location of the cell set with a function.
- Save settings, and then click Preview.info
In the example, the calculation target is the cell with age field.
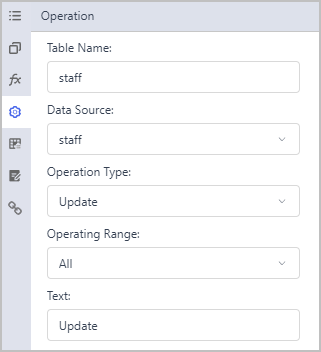
Operation
Add update and delete funtions to the report to edit data from relational database.
- Add a data source from Data Query to the report.
- Select another cell next to the data cell, and then click Operation at the lower-right corner.
- Set the cell operation.
| Parameter | Description |
|---|---|
| Table Name | Name of the table used in data query. |
| Data Source | Name you set for the data query. |
| Operation Type |
|
| Operating Range | Select the range to which the operation applies. |
| Text | The text displayed on the operation button. |
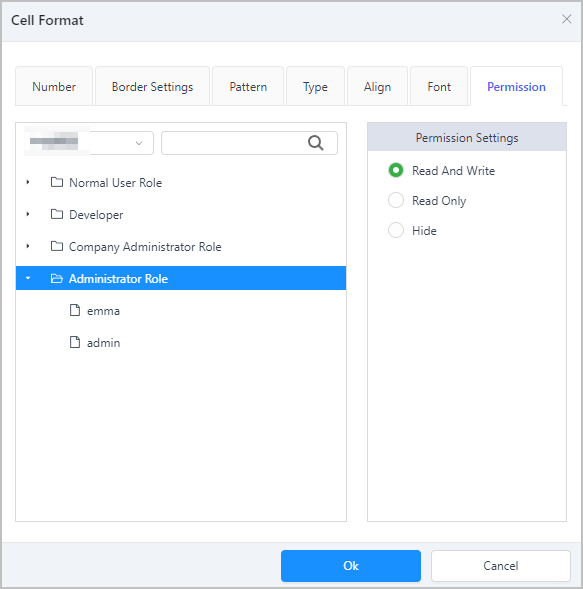
- Select Cell Format > Permission on the top tool bar, and then grant read and write permission of the selected cell to a role.
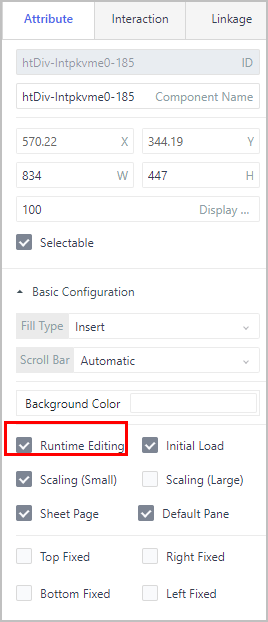
- Enable Runtime Editing for the report under Attribute.
- Set a primary key for fields to be operated on, and preview the report.
If the primary key of the data source is changed and saved, you need to refresh the current page for further changes.
Conditional Format
Set different styles for the selected cells based on the set conditions. The function is similar to Excel.
Filling/Data Entry Format
Set a template for adding to, updating or deleting data from form template or relational data table.
- Click Filling/Data Entry Template at the top tool bar.
- Click
 and select Built-in SQL to add a data change template.
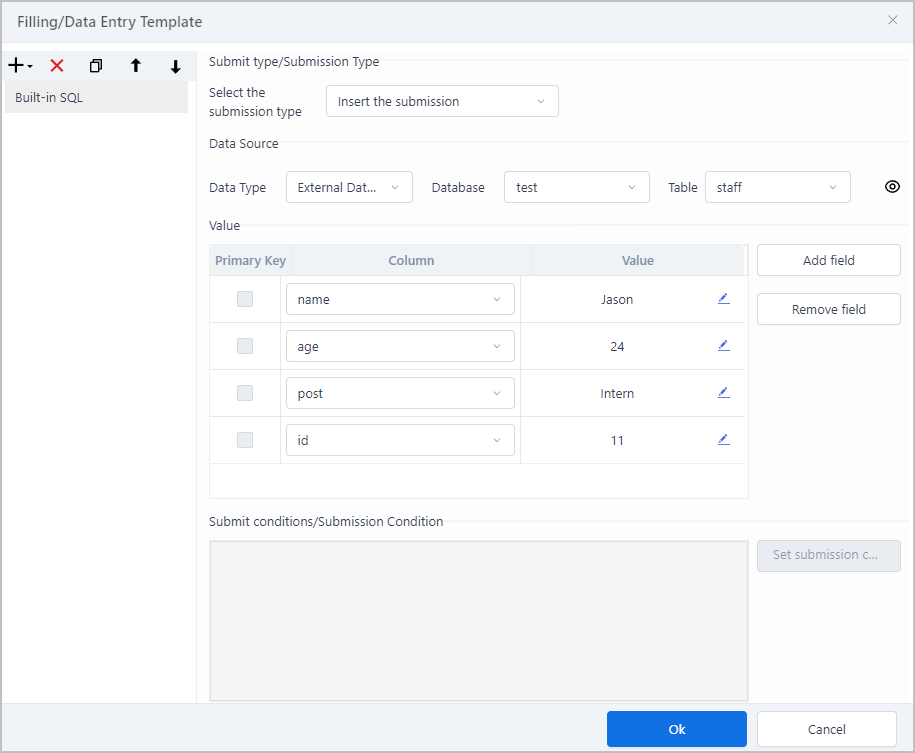
- Select the edit mode of data change from insert, update and delete next to Select the submission type.
- Select the data source from the added relational database or form template.
- Specify the edit fields.
- Make sure you set the field data type the same as the target data source field.
- For string, integer, float, boolean and date type pf data, the set value is filled in the selected field.
- For cell, the selected cell value is filled in the selected field.
- For cell group, enter A1,A2,A3 to insert the corresponding values to the selected field and only for inserting data in batches.
 tip
tipYou can use cell/cell group to move data from one data source to another.
- (optional) Click Set submission conditions to set the conditions of the operation, such as delete and update.

- Select a cell on the report, and then click Filling/Data Entry at the lower-right corner.
- Select the template you just added.
| Parameter | Description |
|---|---|
| Filling/Data Entry Template | Select the data change template. |
| Trigger action | Actions to the cell to trigger the data change. |
| Operation Range | The range of the data change. For insert and delete operations, the range can only be Row. |
| Text | Text displayed on the cell. |
- Save and preview the page, and click the set cell to check whether the data is changed.
Page Link
Set the click event for the selected cell to redirect to another page.
- Select a cell on the report, and then click Page Link at the lower-right corner.
- Click Add Event, and select Cell Clcik event.
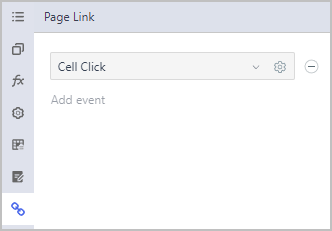
- Click
 to set the link details.
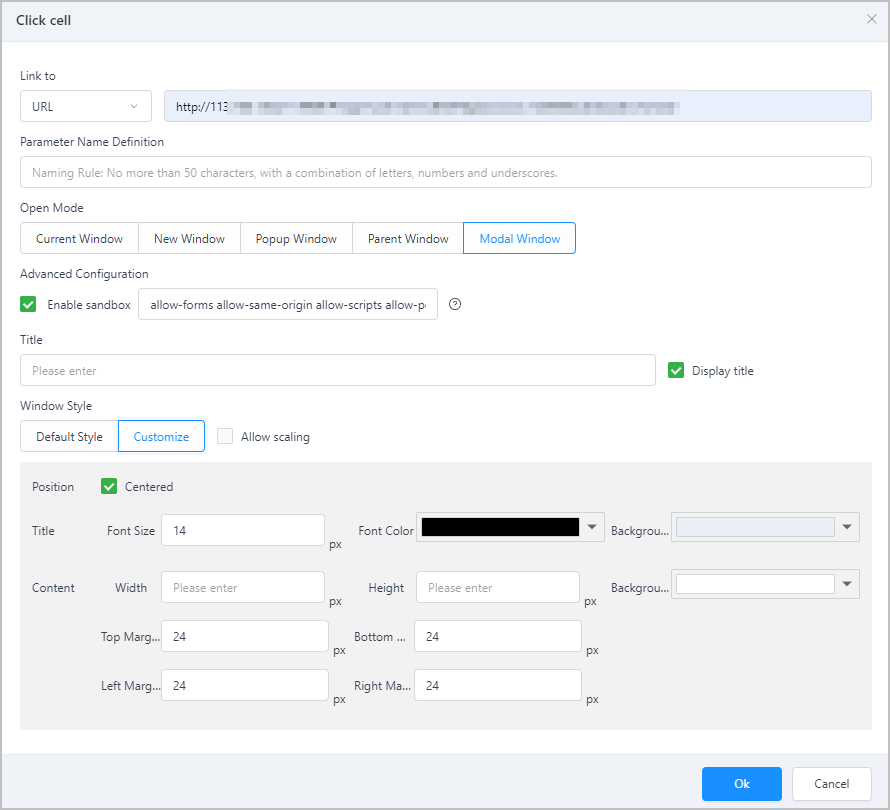
| Parameter | Description |
|---|---|
| Link to | When clicking the cell, the set page or URL is redirected to. |
| Open Mode | Set the window type to display the linked page. You can set the style of the modal window. |
Report Linkage
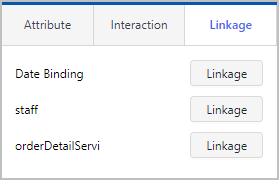
You can link the report to other elements such as button, search box and input box to integrate, search for and export important data. Each data source added to the report has a corresponding linkage button under Linkage.
This chapter demonstrates data linkage of report in free layout.
History Data Linkage
- Add a history data source to the report, and add 2 date picker elements to the page.
- Set them to start and end date respectively.tip
Change the name of both elements for easy recognition.
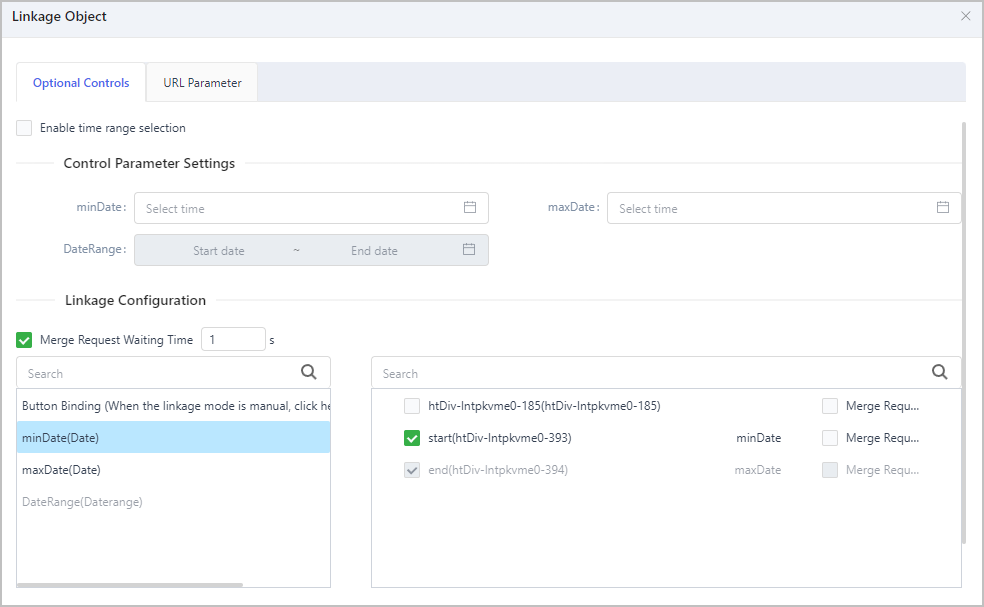
- Select the report and then click Linkage next to Date Binding under Linkage.
- Bind minDate and maxDate to corresponding start and end date elements, and then click Save.
- Preview the page, and select a period to check the corresponding results.
Form Data Linkage
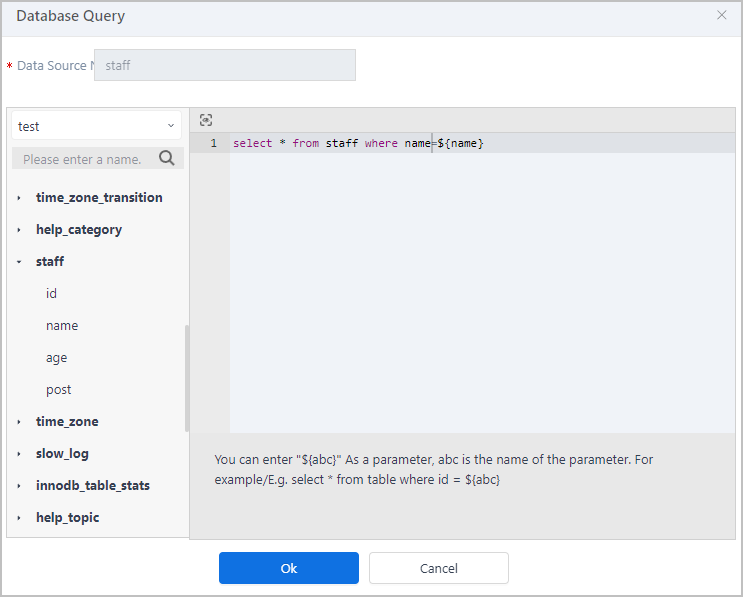
- Double-click the report, and then under Data Source Management, click Data Query to add a data source with the result of the sql commands.
- Write a sql command and use
${"{"}parameter{"}"}as the input parameter that can link with the report.
- Drag data fields to the report, and then save the table and go back to the page canvas.
- Add an input box to the canvas, and then click Linkage next to the data source name , to link the input box to the report.
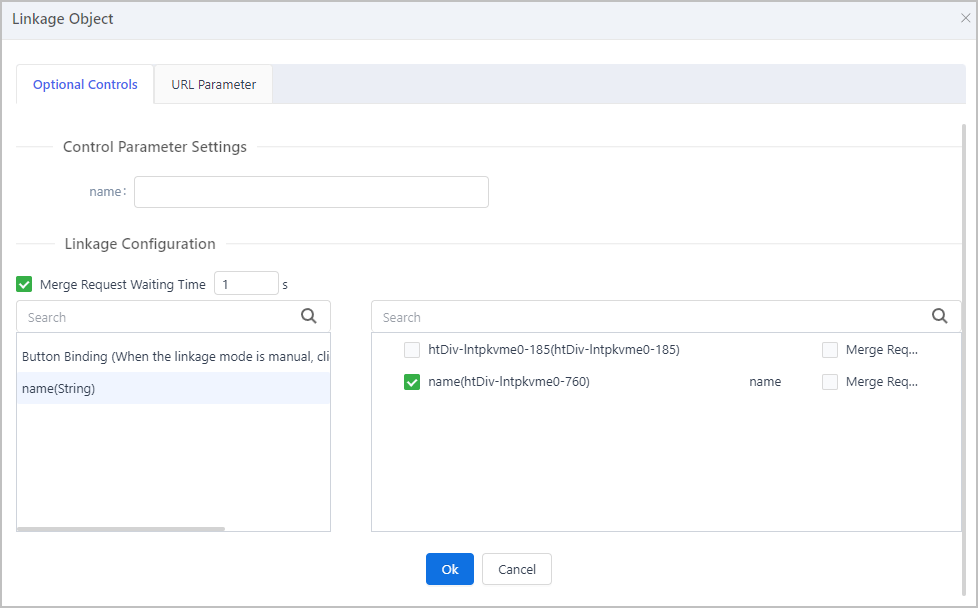
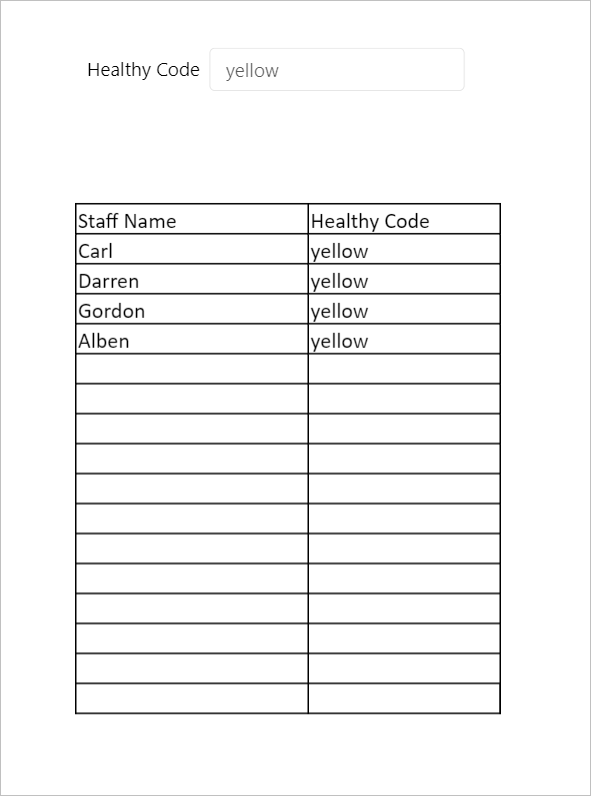
- Click Save, and then preview the page.
Enter a parameter in the input box, and then the report displays data filtered based on the input content.
Service Data Linkage
For details on this part, see Sales Order Report Demo.
Report Group
Group the report to display data by time or field.
- Drag fields to cells from the data source list, and then set cells that contain the property based on which the report data is grouped to be the parent cell and join them.
- Use the parent cell data as the general time period, set its property at the lower-right corner.
- Set Data Type to History Data.
- Set Display Type to Display Time.
- Set Time Granularity to 1 Week.
- Set Group Key Value to Time.
- Set Fill Type to Autofilland Filling Orientation to Horizontal Padding.

- Similarly, set the property of the first sub cell, which is the time period of groups.
- Set Data Type to History Data.
- Set Display Type to Display Time.
- Set Time Granularity to 1 Day.
- Set Group Key Value to Time.
- Set Fill Type to Autofilland Filling Orientation to Vertical Padding.
- Set the property of the second sub cell, which is the average flow.
- Set Data Type to History Data.
- Set Display Type to Display Value.
- Set Time Granularity to 1 Day.
- Set Numeric Type to Average Value.
- Set Group Key Value to Time.
- Set Fill Type to Autofilland Filling Orientation to Vertical Padding.
- Set the property of the third sub cell, which is the maximum temperature.
- Set Data Type to History Data.
- Set Display Type to Display Time.
- Set Time Granularity to 1 Day.
- Set Numeric Type to Maximum Value.
- Set Group Key Value to Time.
- Set Fill Type to Autofilland Filling Orientation to Vertical Padding.
- Save settings and then click Preview.
Related Operations
- Print Report
Add a button in the design center, add a click event and write a script for the button to print the report in the operation center.
var report = scriptUtil.getRegisterReactDom('{component ID}').report;
report.doPrint();
- Export Report
Add a button in the design center, add a click event and write a script for the button to export the report in the operation center.
var report = scriptUtil.getRegisterReactDom('{component ID}').report;
report.doExport('xlsx');
- Filter Report
Advanced filter for service or relational data. You can add one or more filtering conditions to view the filtered data in the operation center.
- Select a cell with data, and then select Filter > Advanced Filtering from the toolbar.
- Set filtering conditions in the pop-up window.
- Select whether to apply filtering conditions of the parent cell to the selected cell. If applied, the result conforms to filtering conditions of both cells.info
This is only available when both cells using data from the same data set.
- Select condition types.
- General: Define filtering conditions to data columns.
- Formula: Use formulas to set filtering conditions. Presently not available.
- Set filtering conditions, and then click OK.
You can add more conditions and set their relations.

- Select whether to apply filtering conditions of the parent cell to the selected cell. If applied, the result conforms to filtering conditions of both cells.