Gas Monitoring Process Demo
Overview
This demo demonstrates the process of gas monitoring in supOS platform.
info
Data used in the demo is for reference only.
Operation Process

Connecting Data Source
Add necessary equipment for gas monitoring such as heating furnace and desulfurization tower to X-Collector, and then X-Collector transmits data to supOS for subsequent template creation and data calling.
- Log in to X-Collector, and then select RTD Collector > Source.
- Click Add.
Enter information of the equipment.infoMake sure necessary data tags are synchronized to the source of X-Collector. For details, see Configuring X-Collector.
- Log in to supOS platform, and then click
 to go to the design center.
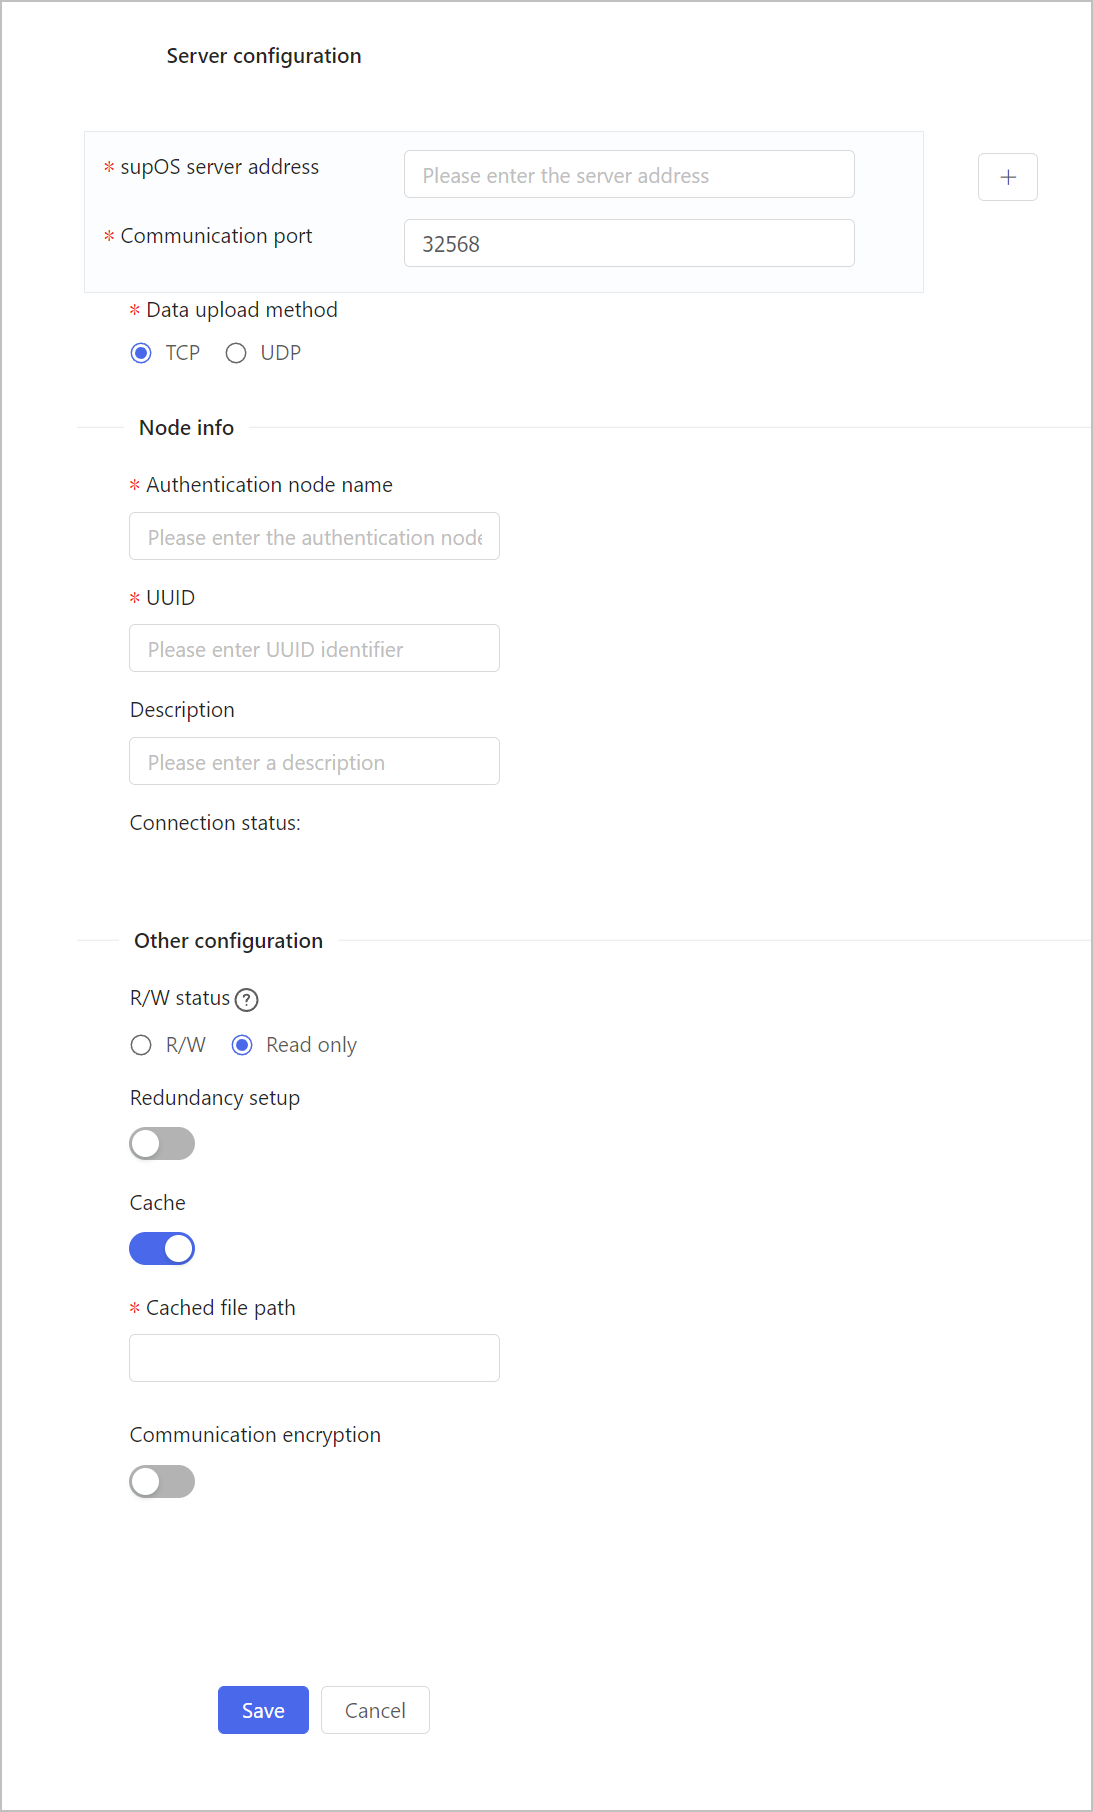
 - Select Collection Node Management > Authentication, and then click
 to add a collector.
Enter collector information and set type to common Collector. For details, see Connecting Common Collector. - On X-Collector, select RTD Collector > Connection Info, and then click Add, enter corresponding information to add the collector you just added on supOS platform.

- On supOS platform, select Collection Node Management > Status, find the collector you added, and then click OK to complete the data source adding.
Now you can see a new instance is added under Object Model Management > Object Instance > Entity Template > Collector Template.
Creating Object Template
info
- After connecting data source, the collected data is added to the supOS platform that you can directly use during application development.
- If you need to do data cleaning or do basic calculation, you can create a new template instance.
- On supOS platform, select Object Model Management > Object Template > Entity Template, and then click
 to add a template.
 - Click Object Instance tab, and then under Entity Template, find the template you added and create a new instance.
- Inside the instance, click Attributes tab, and then add a new attribute.
Next to Data Sources on the Attribute Info panel, you can click Setup to select a data source and do basic calculations to it.infoFor details on calculations, see Configuring Data Source.

- Click OK.
Creating Process Application
On Business Designer, draw a process diagram of the gas monitoring system. With the collected data, you can view the monitor gas status in real time.
- On supOS platform, select Business Designer >
 to add a new application.
 - Click Edit Page to enter the application, and then add a new page.
- On the page, use elements on the left side and provided templates to draw a diagram of the gas monitoring system.
- Add data sources to corresponding data connection elements.

- Double-click rectangles that represent the liquid level of equipment, and then under Filling, add corresponding data source and set filling rules.

- Add buttons for opening and closing the furnace at the lower-right corner and write corresponding script for Click event under Interact on the right.
- Open the furnace
document.getElementById('image id on the furnace').style.visibility = 'unset'; - Close the furnace
document.getElementById('image id on the furnace').style.visibility = 'hidden';

- Open the furnace
- Click on the diagram, and then under Interact on the right side, write a script for Content Loading to control the furnace automatically based on corresponding property value.
function aa() {
    var params={
        "propName":'Property_218' //define the property value that controls the furnace
    }
     scriptUtil.callFunction('<em>template namespace.template alias/instance alias</em>', 'getPropertyValue',params).then(function(res){
        console.log(res.data); //get and print the property value

        var result = res.data; //set the results according to different property values
        if(result < 5) {
            document.getElementById('htDiv-l7r2kth40-62537').style.visibility = 'hidden';
        } else {
            document.getElementById('htDiv-l7r2kth40-62537').style.visibility = 'unset';
        }
    });
}
aa();
setInterval(() => { set the refresh rate of property value
  aa();
}, 2000);

- Save the page and go back to the Business Designer page, and then publish the application of gas monitoring.
Demo Effect
