Dynamic Effect
Dynamic effects display real-time status of equipment to simulate production process going inside the plant.
Visible
Controls whether the graphic element is visible when the collected data changes.
- Double-click a graphic element or right-click a grouped element, and then click Dynamic to open dynamic effect configuration window.
- Click Visible, and then click
 to select an object.info
You can also select Expression from the drop-down list next to Data Source and write a script.
- Select Type of Data.
- Analog: Select between Quantities and Percentage. You need to set lower and upper limits as conditions for dynamic effect of the graphic element.
- Switch: Only True and False. Set effect for each value and the element displays as configured when the collected data changes.
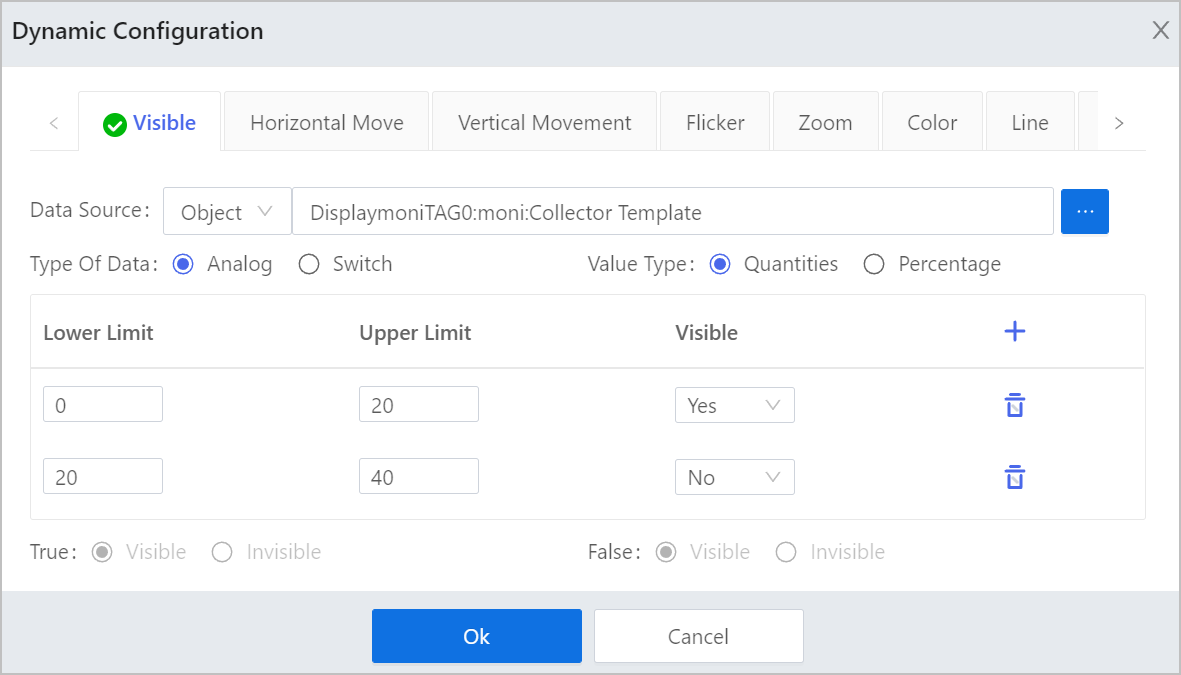
- Set limits and corresponding visible effects, or switch value and corresponding visible effects, and then click OK.
As shown in the following figure, when the collected value is between 0-20, the element is visible, and when it is between 20-40, it is invisible.
Movement
Controls the horizontal or vertical movement of an element.
In this section, Horizontal Movement is used as an example.
- Double-click a graphic element or right-click a grouped element, and then click Dynamic to open dynamic effect configuration window.
- Click Horizontal Move, and then click to select an object.
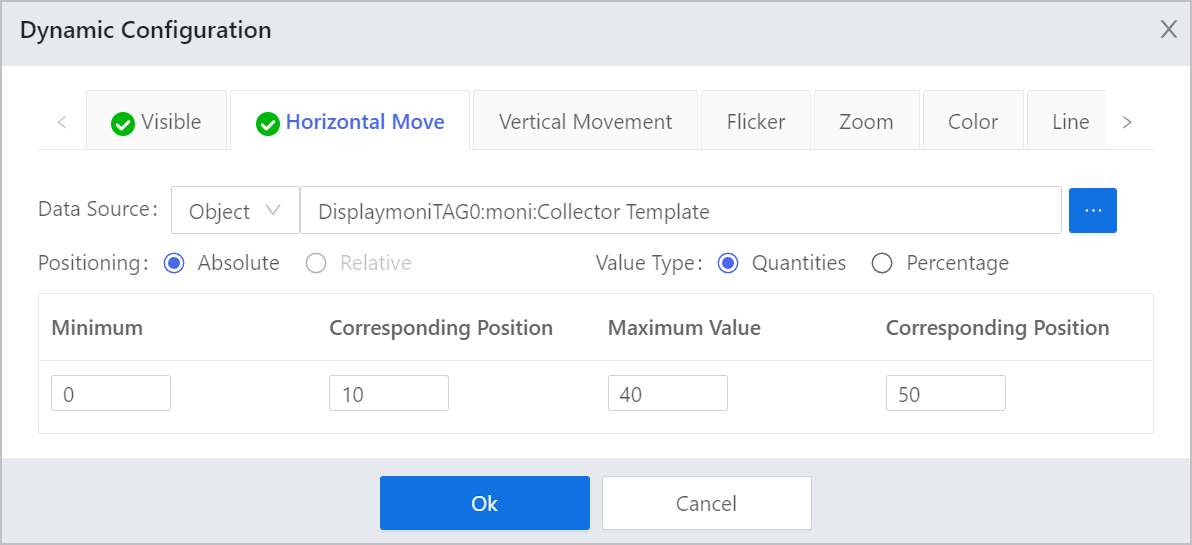
- Select Positioning.
- Absolute: Use the current position of the element as position 0. It is selected by default.
- Relative: Presently unavailable.
- Select Value Type between Quantities and Percentage, and then set the minimum and maximum values and corresponding positions of the element.info
When the set data range is exceeded, the element can only move between the set position range.
- Click OK.
Flicker
Controls the dynamic flashing and flashing color of the element.
- Double-click a graphic element or right-click a grouped element, and then click Dynamic to open dynamic effect configuration window.
- Click Flicker, and then click to select an object.
- Select Type of Data.
- Analog: Select between Quantities and Percentage. You need to set lower and upper limits as conditions for flashing effect of the element.
- Switch: Only True and False. Set flashing effect for each value and the element displays as configured when the collected data changes.
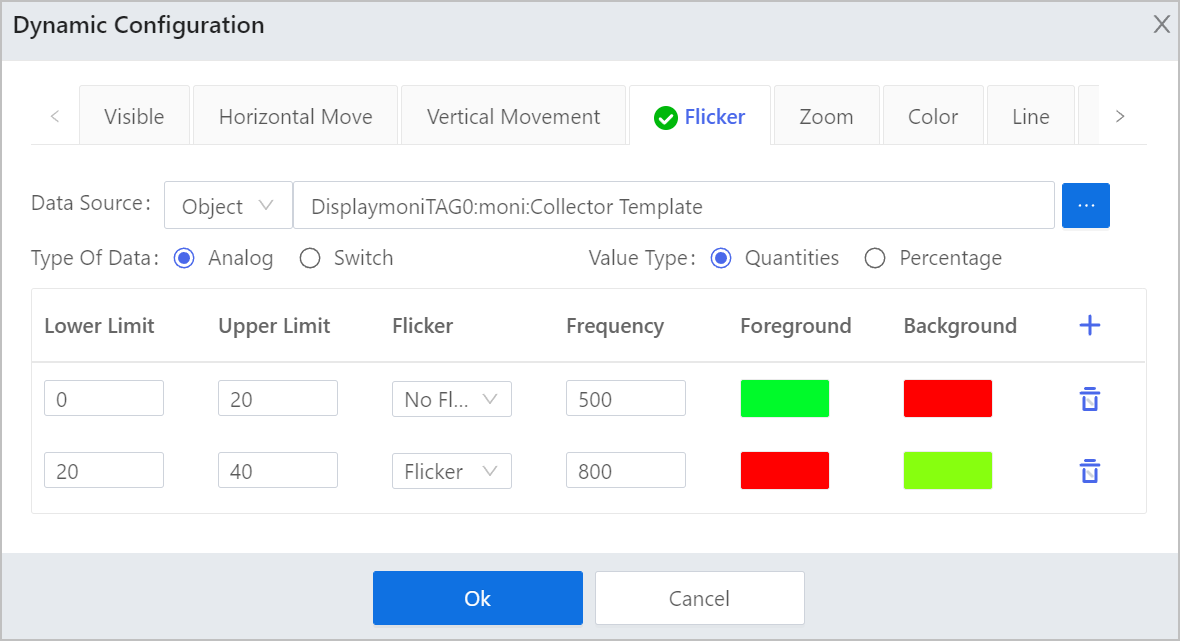
- Set limits and corresponding flashing effects, or switch value and corresponding flashing effects, and then click OK.
As shown in the following figure, when the collected value is between 0-20, the element is flashing between green and red at a frequency of 500, and when it is between 20-40, it is flashing red and green at a frequency of .
- Click OK.
Filling
Controls the dynamic filling and filling color of the element.
- Double-click a graphic element or right-click a grouped element, and then click Dynamic to open dynamic effect configuration window.
- Click Filling, and then click to select an object.
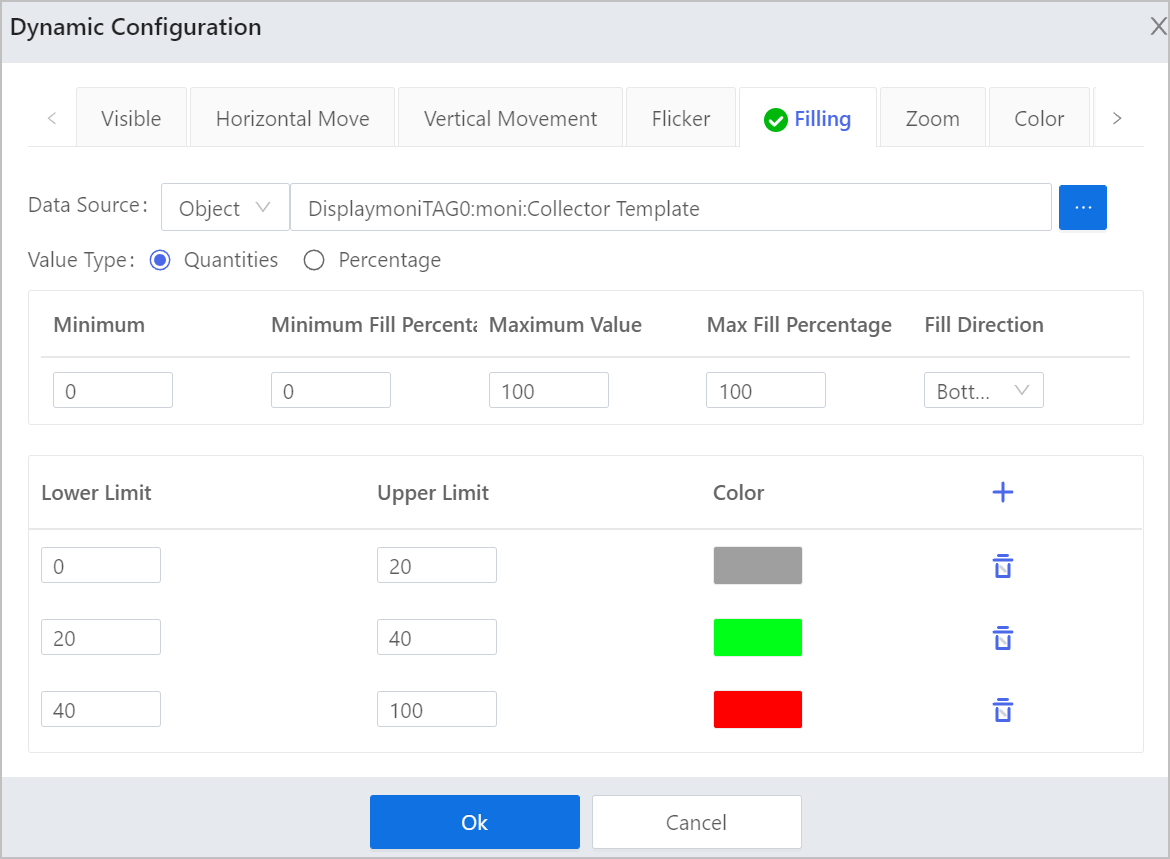
- Select Value Type between Quantities and Percentage, and then set the minimum and maximum values and corresponding filling percentage and direction.
- The filling percentage moves along with the set value. For example, set Minimum Value to 20, and Minimum Fill Percentage to 0, meaning the element starts filling the set color when the data value reaches 20.
- Select Fill Direction, and the element fills from the set direction.
- Set ranges and corresponding colors in different levels for clear notification.
- We recommend set multiple ranges to improve alarm effect. Fro example, when the data value reaches a dangerous range, set the filling color to red.
- When the set data range is exceeded, the element filling is in default color.
- Click OK.
Zoom
Controls the dynamic zoom ratio of the element.
- Double-click a graphic element or right-click a grouped element, and then click Dynamic to open dynamic effect configuration window.
- Click Zoom, and then click to select an object.
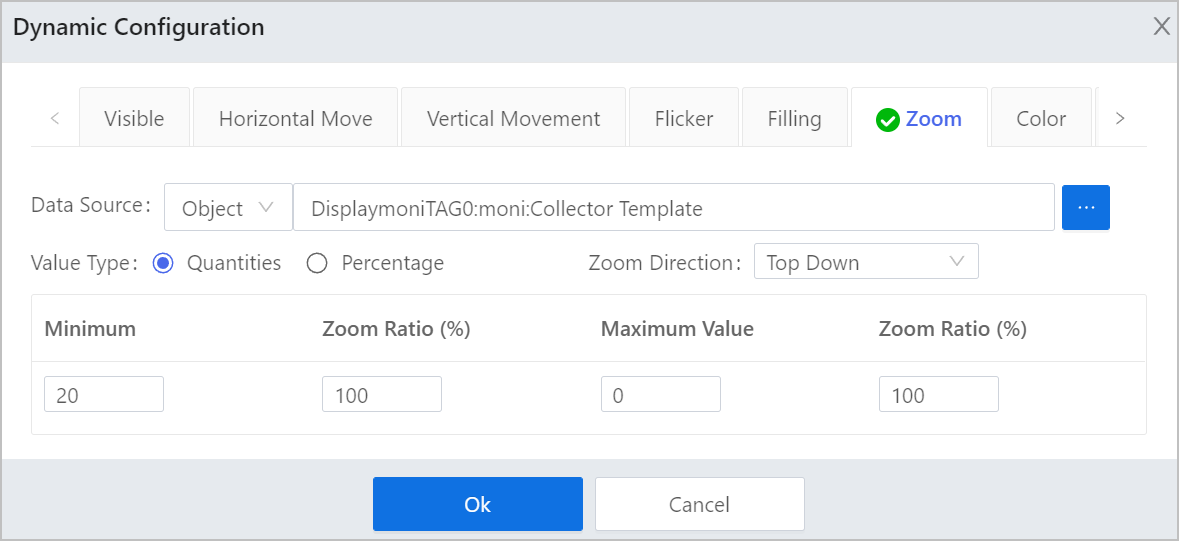
- Select Value Type between Quantities and Percentage, and then set Zoom Direction.info
The element zooms from the set direction.
- Set the minimum and maximum values and corresponding zoom ratios.
The zoom ratio changes along with the set value. For example, set Minimum Value to 20, and corresponding Zoom Ratio to 0, meaning the element starts zooming in when the data value reaches 20.
The element can only be zoomed in based on the set ratio in equal proportions.
- Click OK.
Color
Controls the dynamic color of the graphic element.
- Double-click a graphic element or right-click a grouped element, and then click Dynamic to open dynamic effect configuration window.
- Click Color, and then click to select an object.
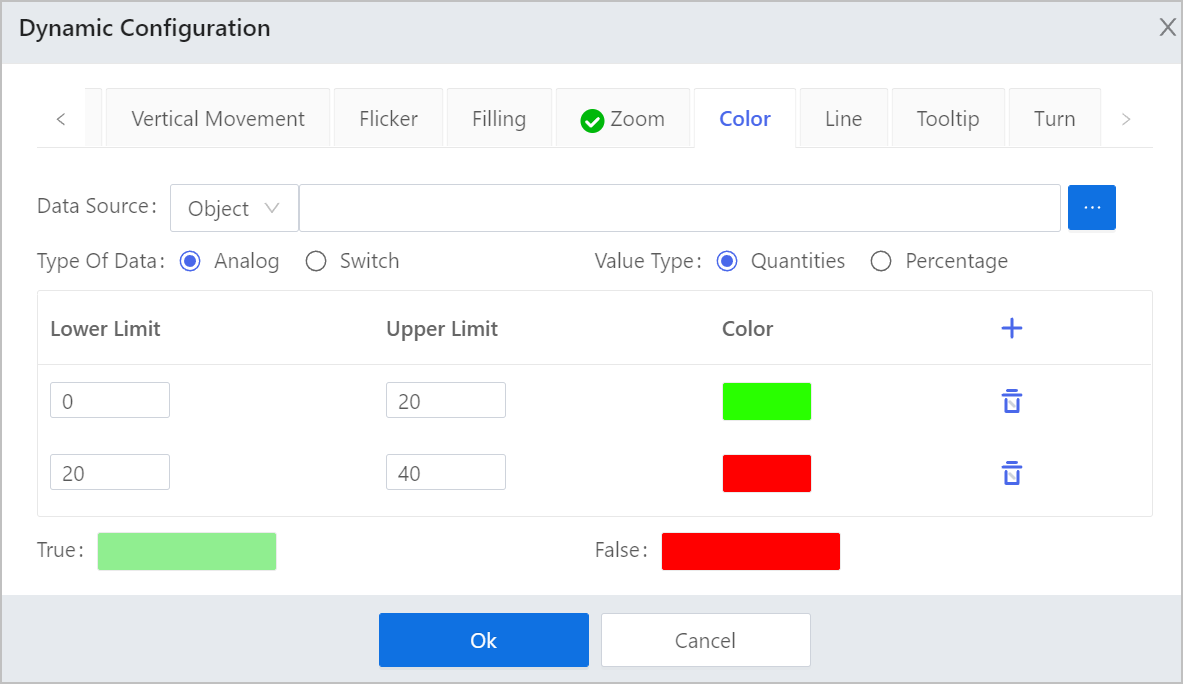
- Select Type of Data.
- Analog: Select between Quantities and Percentage. You need to set lower and upper limits as conditions for dynamic effect of the graphic element.
- Switch: Only True and False. Set effect for each value and the element displays as configured when the collected data changes.
- Set limits and corresponding colors, or switch value and corresponding colors, and then click OK.
As shown in the following figure, when the collected value is between 0-20, the element is green, and when it is between 20-40, it is red.
Line
Controls the line color or border color of the graphic element.
The configuration of line or border color is similar to that of the element color. For details, see Color.
Tooltip
Indicates data source information. You can point to the element and the tooltip appears in operation center.
- Double-click a graphic element or right-click a grouped element, and then click Dynamic to open dynamic effect configuration window.
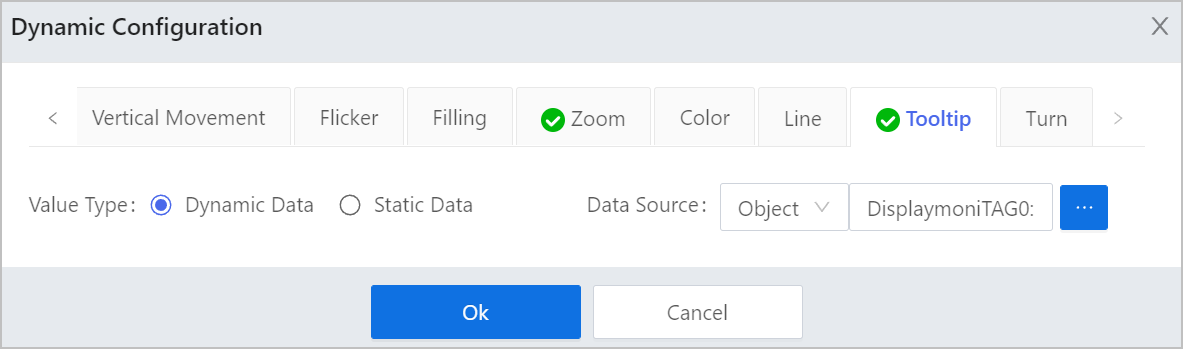
- Click Tooltip, and then select Value Type between Dynamic Data and Static Data.
- Dynamic Data: Select a data source, and the tooltip displays the selected data.
- Static Data: Set a tip and the tooltip displays the entered tip.
- Click OK.
Turn
Controls the dynamic turning angle of the element.
- Double-click a graphic element or right-click a grouped element, and then click Dynamic to open dynamic effect configuration window.
- Click Turn, and then click to select an object.
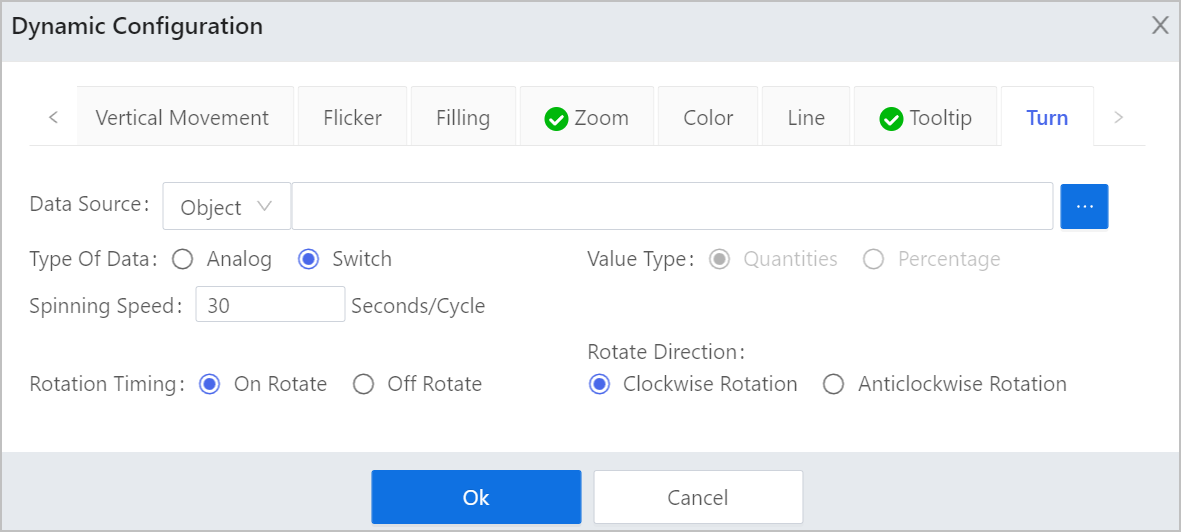
- Select Type of Data.
- Analog: Set the minimum and maximum values and corresponding turning angles. For example, set Minimum Value and Maximum Value to 20 and 100 respectively, and corresponding Angle to 0 and 180, meaning the element stays the same when the data value reaches 20 and turns upside down when it reaches 100.
- Switch: Set Spinning Speed, and then select Rotation Timing and Rotate Direction. For example, in the figure below, the element rotates in clockwise at a speed of 30 seconds a cycle when the switch value is On.
- Click OK.
Flow
Controls the dynamic flow effect of the pipeline element.
- Double-click a pipeline, and then click Dynamic to open dynamic effect configuration window.
- Click Flow, and then click to select an object.
- Select Type of Data.
- Analog: Set value ranges, corresponding color, flow speed and direction.
- Switch: Set corresponding color, flow speed and direction for True and False
- Set Line Length and Interval, and then click OK.
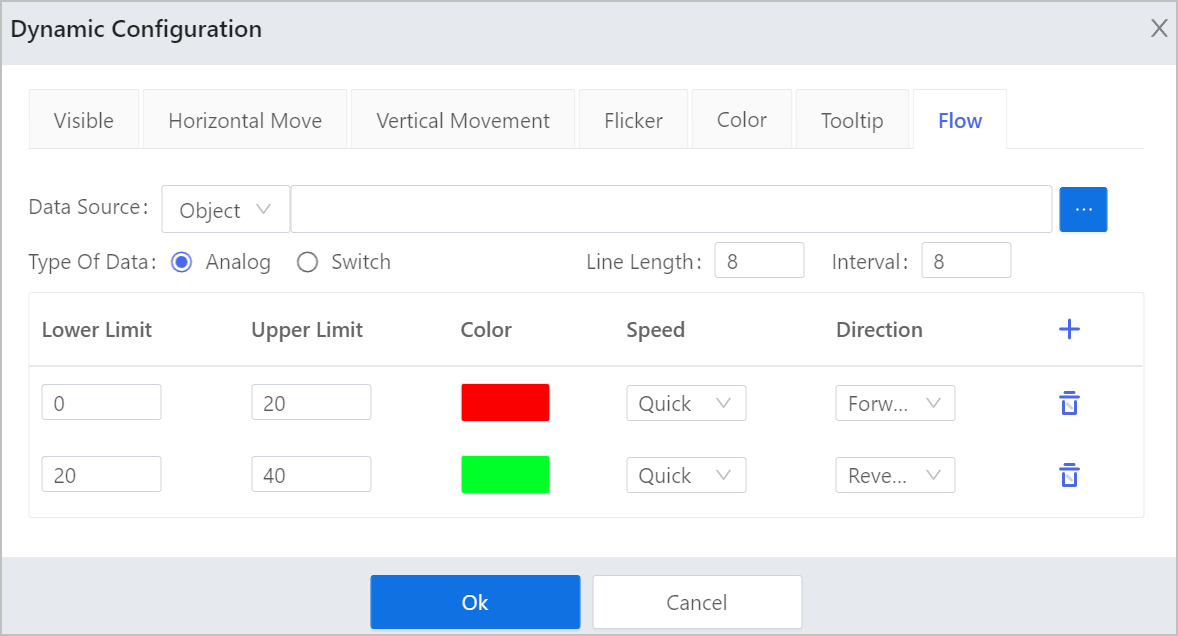
- Click OK.
Text Dynamic Effect
Controls the dynamic display effect of text element.
- Double-click a text element, and then click Dynamic to open dynamic effect configuration window.
- Word
- Click Word, and then click to select an object and enter an expression.
- Set ranges and corresponding text contents, and then click OK.
When the data reaches the set limits, corresponding texts are displayed.
- Text display
- Click Text Display, and then click to select an object or enter an expression.
- Select a color of the text, and then click OK.
The text is displayed in the set color.
- Analog display
- Click Analog Display, and then click to select an object and enter an expression.
- Set ranges and corresponding text colors, and then click OK.
When the data reaches the set limits, texts are displayed in set colors.
- Switch display
- Click Switch Display, and then click to select an object and enter an expression.
- Set corresponding texts and colors for TRUE and False, and then click OK.
When the value is TRUE or False, set texts are displayed in set colors.