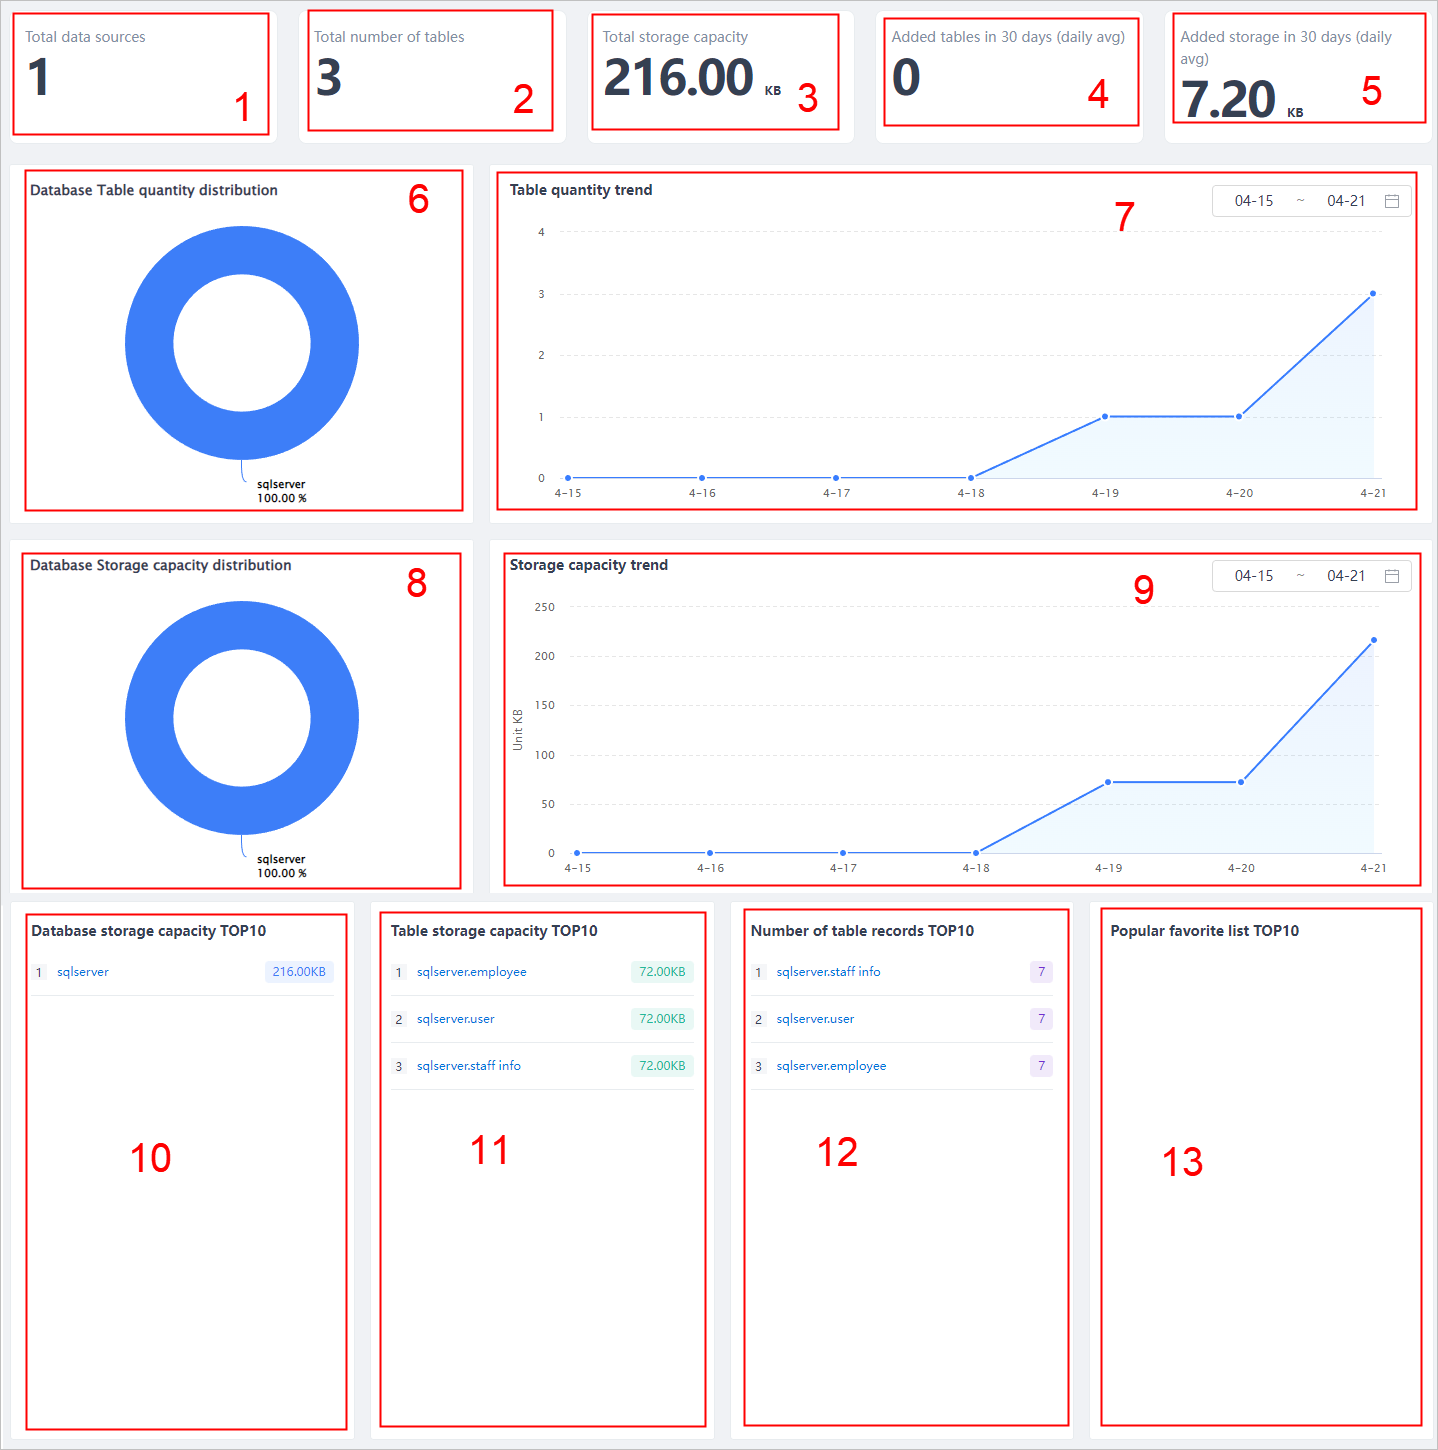
Data Resource Overview
Log in to supOS, and then select Data Intelligence > Data Asset > Data resource overview.
| No. | Section | Description |
|---|---|---|
| 1 | Total data sources | Total number of collected and enabled data sources. |
| 2 | Total number of tables | Total number of collected tables. |
| 3 | Total storage capacity | Collected total storage. |
| 4 | Added table in 30 days (daily avg) | Daily average number of added tables in the recent 30 days. |
| 5 | Added storage in 30 days (daily avg) | Daily average amount of added storage in the recent 30 days. |
| 6 | Database table quantity distribution | Displays table quantity distribution by databases in a pie chart. |
| 7 | Table quantity trend | Displays the number of tables in specific dates and forms a trend in a line chart. |
| 8 | Database storage capacity distribution | Displays storage capacity distribution by databases in a pie chart. |
| 9 | Storage capacity trend | Displays the database storage in specific dates and forms a trend in a line chart. |
| 10 | Database storage capacity TOP10 | Top 10 database storage capacity. Click data sources to view the details. |
| 11 | Database table quantity TOP10 | Top 10 table storage. Click tables to view the details. |
| 12 | Number of table records TOP10 | Top 10 table records. Click tables to view the details. |
| 13 | Popular favorite list TOP10 | Top 10 favorite list. Click tables to view the details. You can add favorites in Metadata center. |